

How I cut 44% of the CPU work in a Rust WebGL game without changing a pixel
I build a browser game with a cast of about 110 animated cartoon characters. You can pose them and switch between view types and interactive backgrounds. I was able to speed up the loading time from 2s to 0.47s by dropping unnecessary calculations.
SVG characters drawn as triangles
Every character is a vector drawing, because zooming in still maintains sharp picture quality. This would not be possible to achieve in quads with textures.
A browser is able to draw SVG on its own, but animating, physics engine etc. will need efficient backend anyway. A graphics card only knows triangles as it has no idea what a curve is. Every shape has to be converted to triangles and this process is called tessellation. My engine does it in Rust, compiled to WebAssembly so it can run in the browser.
The first version worked, but it was slow
The first WebGL version reused drawing code from the older JavaScript version of the game, and that code built every character as SVG text. Visually it was correct, every character appeared and was sharp. The heaviest views however needed 2 seconds to appear on first load, and the default view about half a second.
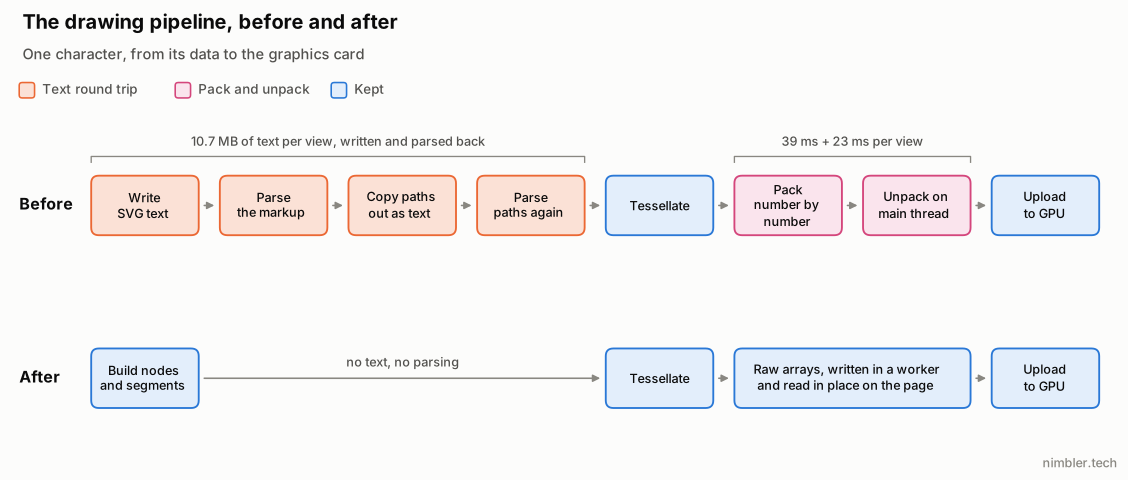
When I profiled it, more than half of the time was the engine talking to itself in text. For every character it:
- formatted every number of the drawing into SVG text;
- parsed this text back;
- copied the outline of each shape out as text again;
- parsed every outline a second time;
- cut the shapes into triangles, which is what the graphics card needs;
- packed the triangles into bytes, handling each number separately, so a background worker could send them to the page, where they got unpacked again before going to the graphics card.
Steps 1 to 4 turn numbers into text and then back into the same numbers. Step 6 does the same thing with bytes.
This text came with the reused drawing code, and inside the WebAssembly engine it was read only by the engine itself. For the default view it was 10.7 MB, written and read back every time the cast was built.
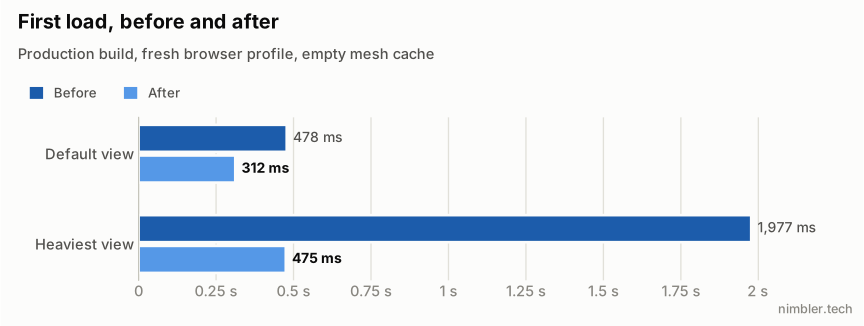
The plan was to build shapes directly as numbers and send the triangles to the page as they are, without text in between. After the changes the heaviest views appear in 475 ms instead of 2 seconds and the default view in 312 ms instead of 478. The picture is the same. Before the first change I recorded 2,536 fingerprints, and the triangles match all of them.
Measuring first, to know what to improve
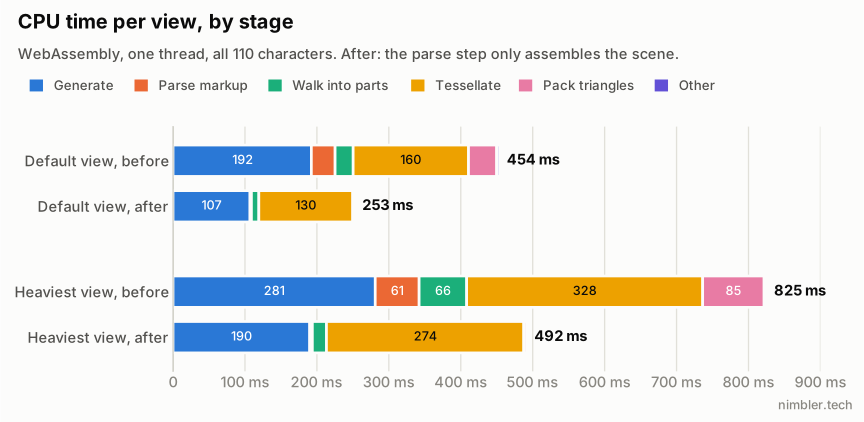
Before changing anything I created benchmark. It runs a whole view through the pipeline in WebAssembly on one thread and times every stage. Default view, all 110 characters:
| Stage | Time |
|---|---|
| Generate the markup | 192.3 ms |
| Parse it | 33.0 ms |
| Walk it into parts | 25.1 ms |
| Tessellate (parsing every path again) | 160.4 ms |
| Pack the triangles | 39.1 ms |
| Other (preparing each character’s settings) | 3.9 ms |
| Total | 453.8 ms |
The heaviest view took 825 ms and wrote 19.3 MB of markup.
The biggest surprise was in “generate”. The default view’s markup holds 1.58 million numbers, and formatting them as text took 133 of those 192 ms, about 70%. Each number was first turned into its own string and only then copied into the next string.
On the other end it was similar. The heaviest views produced about 40 MB of packed triangles each. Loading them on the page’s main thread took 0.9-1.2 seconds per view, and the unpacking alone was 23-51 ms before any upload started.
My plan estimated that taking the text out would cut 40-50% of the CPU work. I wrote this number down so I could not move it later without noticing.
Keeping the visual output identical
A rewrite like this touches every drawing function, about 1,370 places in 27 files that formatted numbers into text. After each change I wanted to know if any triangle moved.
So before the first change I recorded a fingerprint of the pipeline output: a hash of the triangles for every character in every view, in grey and in colour, at both levels of detail, plus edited bodies and posed characters. 2,536 hashes in total. Backdrops (the scenery behind the characters, drawn when the game is built) have a hash too. Every step had to reproduce all of them. The whole check takes about 7 seconds on a 24-thread machine.
To match exactly I had to keep the quirks of the old text pipeline. There were three:
- Numbers were formatted with JavaScript rules, where
-0is printed as"0". The new code turns-0into0before using a number, otherwise a hash breaks. - Rounding to fixed decimals also went through text:
-0.01rounded to one decimal is written as"-0.0", which parses back as negative zero. The new rounding produces the same negative zero without text, and a test compares it with the text version on 100,000 values. - Three drawings set the line end to round and later to square. In markup the first attribute wins, so they stayed round. The typed builder keeps the first value as well.
One question was open. The old code compared attribute text to decide which shapes can be merged, so .5 and 0.5 could have kept shapes apart. I compared both groupings on the recorded cases, they were the same, so numbers stayed plain numbers.
Because of this check I could convert a single file, check it, and move to the next. A broken hash told me the drawing and the node that changed, and I fixed it before going further.
Removing the text in steps
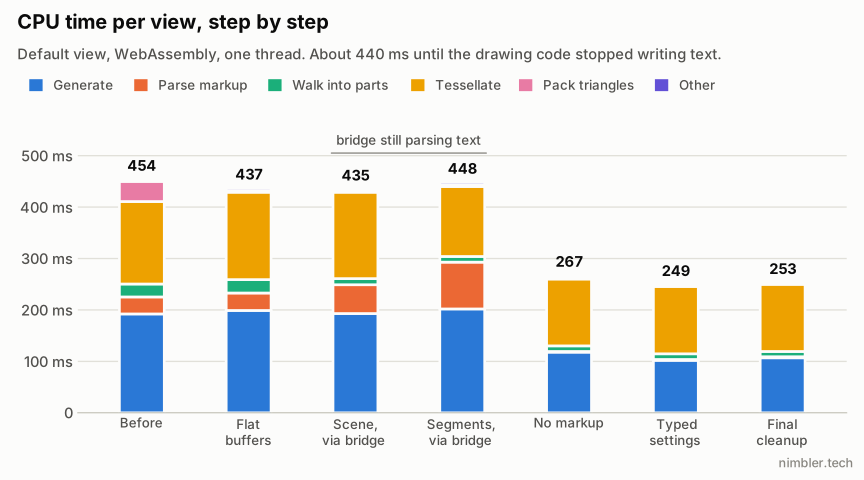
I started with two small changes that didn’t depend on the rest, and then did the long one. The chart at the end of this section follows the default view through every step on the bench, except the first one, because it runs once per page load and not once per view.
Every step was measured in a separate run, so a stage that a step didn’t touch can be a few milliseconds off compared to the table above. Each step is compared with the one before it.
Typed character data. The characters live in a 171 KB JSON file, and the browser parsed it on every load. Now a build step bakes it into a 15 KB typed binary where each field uses the smallest type that fits. Loading takes about 2 ms instead of 4-8, once per page. A typo in the data now fails the build, where before it drew a default.
Flat mesh buffers. Workers packed every triangle number separately (39-85 ms per view) and the main thread had to unpack them. Now a worker writes a small header and then the raw arrays, transfers the buffer, and the page uploads straight from it. Packing went from 39 to about 3 ms. Unpacking is under 1 ms because only the header is read. Cached meshes use the same format. On the bench the total moved only from 454 to 437 ms, because the bench does not time the page’s main thread where the unpacking happened. In the browser the heaviest view’s first load fell from 1,977 to 883 ms before I touched any markup. This was the biggest win of the project.
The scene, through a bridge. The long change was making every drawing function return nodes and segments instead of a string. That is about 1,370 call sites, too many to switch together, so I kept a bridge. The old parser stayed and turned the markup of not yet converted functions into nodes of the new scene. Converted code built the scene directly, unconverted code still wrote text, and both ended up in the same scene. I went from the top down. From this step on the walk into parts read the typed scene and dropped from 26 to 12 ms. The bridge was more expensive than the old parse though (34 to 56 ms), so the total stayed at 435 ms.
Segments, still through the bridge. Paths in the scene became lists of segments, and the tessellator read those instead of parsing path strings. Tessellation fell from 168 to 136 ms, about 20%. The total still went up, 435 to 448 ms, because now the bridge also converted every path string to segments and its step grew from 56 to 91 ms. The same change removed the path text that overlays were building on every frame.
No markup. When the last drawing function stopped writing text, the bridge could go. Here is one small drawing, the outline of a thumb, in both forms. Before, it was SVG text that the engine wrote and then parsed back (attributes split over lines so it’s readable):
<svg xmlns="http://www.w3.org/2000/svg" viewBox="0 0 16 30">
  <path d="M 6,6 C 11,9 13,17 11,23 C 9,27 4,27 3,23 C 3,20 3,17 3,14"
        fill="none" stroke="#2b2232" stroke-width="2"
        stroke-linecap="round" stroke-linejoin="round"/>
</svg>
Now it’s a node in a typed scene. Shape and style are plain Rust values with the numbers already in place:
let outline = Path { segs: vec![
    Seg::MoveTo { abs: true, x: 6.0, y: 6.0 },
    Seg::CurveTo { abs: true, x1: 11.0, y1: 9.0, x2: 13.0, y2: 17.0, x: 11.0, y: 23.0 },
    Seg::CurveTo { abs: true, x1: 9.0, y1: 27.0, x2: 4.0, y2: 27.0, x: 3.0, y: 23.0 },
    Seg::CurveTo { abs: true, x1: 3.0, y1: 20.0, x2: 3.0, y2: 17.0, x: 3.0, y: 14.0 },
] };
let style = Style {
    fill: Some(Paint::None),
    stroke: Some(Paint::Color([43.0 / 255.0, 34.0 / 255.0, 50.0 / 255.0, 1.0])),
    stroke_width: Some(2.0),
    cap: Some(Cap::Round),
    join: Some(Join::Round),
    ..Style::default()
};
Nothing to parse here: the curve is four Seg values and #2b2232 is already four numbers. The code that builds it shows how the types changed.
Before, the drawing code produced a String:
let thumb_line: String = jsfmt!("M {},6 C {},9 {},17 {},23", hx(6.0), hx(11.0), hx(13.0), hx(11.0));jsfmt! formatted every number to text using JavaScript rules. Then this string was pasted into more text, a whole SVG element:
fn filled_outline(path: &str) -> String {
    format!("<path d=\"{path}\" fill=\"{INK}\" stroke=\"{INK}\" stroke-width=\"4.4\" stroke-linejoin=\"round\"/>")
}
Each character ended up as one long String, and the rest of the pipeline took text in and parsed it:
pub fn person_markup(view: &str, spec: &Value) -> String

pub fn build_person(defs: &Tree, markup: &str, fig: i32, place: Mat, base: f64, detail: Detail, now: &dyn Fn() -> f64) -> Result<Vec<PartMesh>, String> {
    let mut t = Tree::parse(markup)?;
    // ...
}

pub fn subpaths_within(d: &str, tol: f64) -> Vec<Sub>
build_person parsed the markup into a tree, and subpaths_within, where tessellation starts, got each path as &str and parsed it one more time.
After, the same line is a Path, a list of typed segments:
pub enum Seg {
    MoveTo { abs: bool, x: f64, y: f64 },
    LineTo { abs: bool, x: f64, y: f64 },
    CurveTo { abs: bool, x1: f64, y1: f64, x2: f64, y2: f64, x: f64, y: f64 },
    ClosePath { abs: bool },
}

pub struct Path {
    pub segs: Vec<Seg>,
}

let thumb_line: Path = path!("M {},6 C {},9 {},17 {},23", hx(6.0), hx(11.0), hx(13.0), hx(11.0));(Seg has some more variants I left out here: arcs, quadratic and smooth curves, horizontal and vertical lines, and an end marker.) The path! macro keeps the readable template, but it reads it at compile time and generates code that pushes Seg::MoveTo and Seg::CurveTo values with the computed numbers. If it can’t read a template, that’s a compile error, so text can’t sneak back in later.
The SVG element and the whole character change type the same way:
fn filled_outline(path: &Path) -> Frag {
    svg!("<path d=\"{}\" fill=\"{}\" stroke=\"{}\" stroke-width=\"4.4\" stroke-linejoin=\"round\"/>", path, INK, INK)
}

pub fn person_scene(view: &str, spec: &Spec) -> Scene

pub fn build_person(defs: &Scene, scene: Scene, fig: i32, place: Mat, base: f64, detail: Detail, now: &dyn Fn() -> f64) -> Vec<PartMesh>

pub fn flatten(path: &Path, tol: f64) -> Vec<Sub>
A Frag is a small piece of a scene that joins with other pieces, like strings used to be glued together, and svg! reads its template at compile time same as path!. In the signatures String became Path, Frag and Scene, the tessellator takes &Path instead of &str, and build_person doesn’t return a Result anymore, because there’s no text left that could fail to parse.
In this one step the total fell from 448 to 267 ms. Generating dropped from 202 to 118 ms, and the 91 ms of parsing in the bridge became about 1 ms of putting the scene together.
Typed settings. The drawing code still looked up each character’s settings in JSON values by string key. With typed fields generating went to 102 ms and the total to 249 ms. A last cleanup removed the leftover bridge code and measured 253 ms, which is within run-to-run variation.
The heaviest view now loads four times faster
On the bench the default view went from 454 to 253 ms of CPU, 44% less, and the heaviest view from 825 to 492 ms, 40% less. Both are inside the 40-50% I wrote down at the start. The WebAssembly module also got smaller, from 6.9 to 5.7 MB.
In the browser, production build, fresh profile:
| View | First load | Repeat load |
|---|---|---|
| Default view | 478 to 312 ms | 216 to 196-222 ms |
| Heaviest view | 1,977 to 475 ms | 1,188-1,437 to 267-403 ms |
Repeat loads vary by tens of milliseconds between runs, so read them as ranges. The default view’s repeat load was short already and any change is lost in that noise.
Where the heaviest view’s first load went:
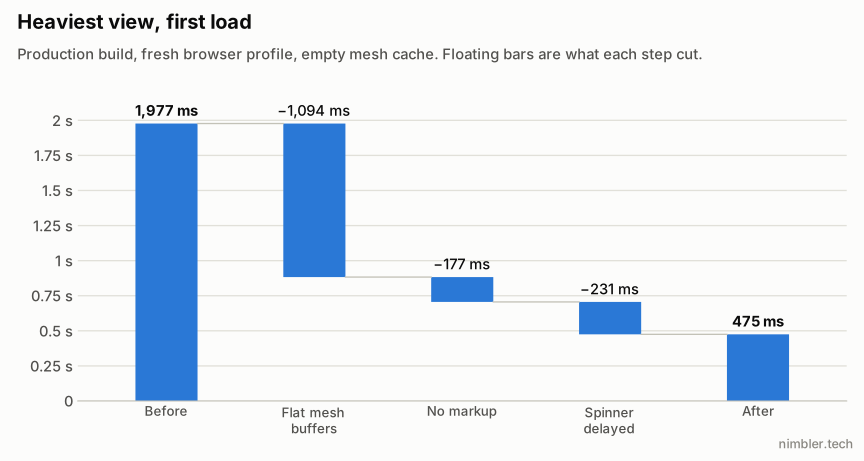
The flat buffers helped the heaviest views the most. Removing the markup is what cut the CPU work, and it helped the default view the most: its first load was 427 ms after the flat buffers and 312 ms once the markup was gone.
The cherry on top: a spinner that slowed the load
With loads of 2 seconds the spinner’s cost was small next to the others. At about 700 ms it was the biggest one left.
A spinner is a CSS animation and the browser redraws it every frame, even when the page is busy. Every redraw makes the browser’s graphics process wait for the screen, and a big upload of triangles can only move in between those waits. Uploads up to about 10 MB fit in the browser’s transfer buffer and took about 2 ms, spinner or not. A 41 MB upload took 55 ms with no spinner on screen and 468 ms with one.
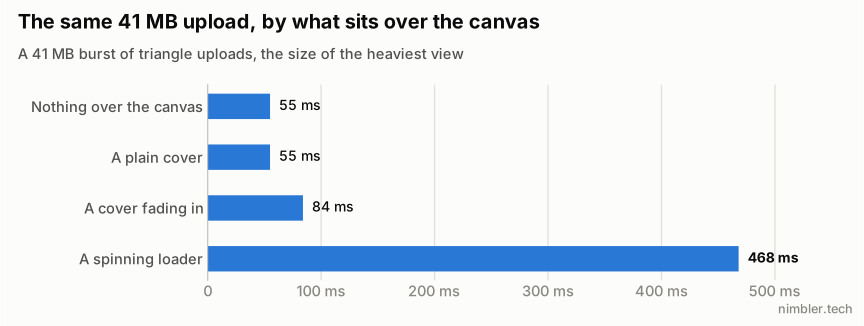
Now the cover over the canvas shows up immediately and the spinner only after 800 ms of work. Loads under 800 ms don’t show it, and slower ones still do. The heaviest view’s first load dropped from 706 to 475 ms.
Lessons for the next optimisation
- Look for text formats between parts of your own program. Here one stage wrote SVG and the next one parsed it, 10-19 MB per view, and the cost was paid twice: once for formatting and once for parsing.
- Record hashes of the output before a rewrite. With them I could check a change of 1,370 call sites after every converted file.
- Do the cheap independent changes first. The flat buffers were a small change and saved 1,094 ms of the heaviest view’s first load, more than the rewrite after them.
- Measure again after every win. Delaying the spinner saved 231 ms, and I only noticed that cost after the bigger ones were gone.
The heaviest views are not done yet. They make about 33,000 graphics calls per frame, which is right at the limit of what the browser’s graphics process can get through in one frame. I already measured which calls cost the most. Cutting them is next.